User's Manual
A complete reference for every TimeGen 5 feature — signals, clocks, buses, separators, the time ruler, annotations, Setup/Hold, time breaks, and export.
Getting started
A new diagram starts empty. Add a clock, a signal, or a bus from the toolbar, and the canvas builds around whatever you add.
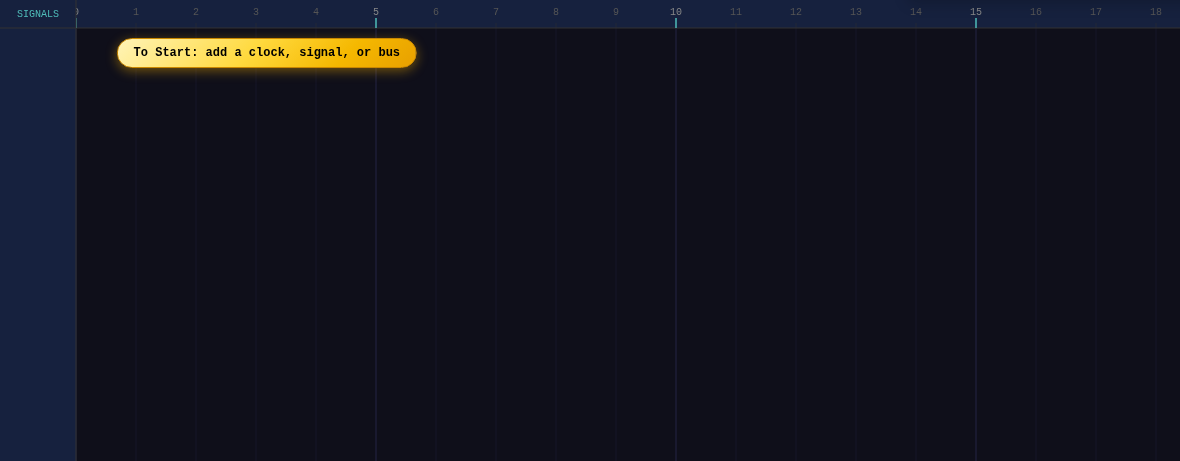
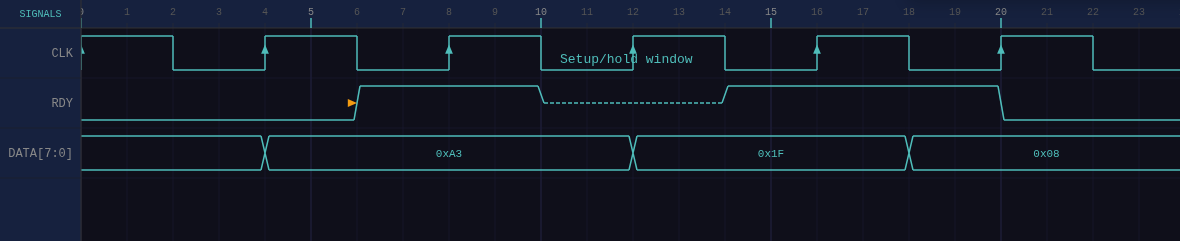
Every row you add — clock, signal, bus, or separator — appears below the last one, with its name on the left and its waveform to the right. Click a row's name to open its properties, or click anywhere in its waveform area to select the row or one of its segments.
The toolbar
Everything you need to build and edit a diagram lives in one row at the top.

| Control | What it does |
|---|---|
+ Clk / + Sig / + Bus / + Sep | Adds a new row of that type at the bottom of the diagram. |
| Select | The default tool — click to select, drag edges to move them. |
| Text | Click anywhere to drop a free text note. |
| Arrow | Click a start point, then an end point, to draw a straight annotation arrow. |
| Bezier | Same as Arrow, but draws a curve — good for connecting things that aren't in a straight line. |
| Setup/Hold | Draws a bracket between two points, labeled with either the time between them or your own text. |
| Time Break | Marks a gap in the timeline. Click a single row, or hold Shift while placing it to break every row at once. |
| Undo / Redo | Ctrl+Z / Ctrl+Y — see Undo, redo & shortcuts. |
| Zoom | Zooms the timeline in or out. Shows the current zoom percentage. |
| File | New, Load, Save, and Export — see The File menu. |
| Theme | Switches between dark and light — see Themes. |
Signals, clocks, buses & separators
Four row types cover everything a timing diagram needs to show.
Signal
A single logic line. Supports every real-world state — not just high and low — including high-Z, weak drive, both-high-and-low, and two distinct glitch types. See Signal states.
Clock
A periodic square wave defined by period, phase, and duty cycle, rather than hand-drawn transitions. See Clock properties.
Bus
A multi-bit value shown as text inside each segment, with an uncertainty crossing mark at every transition. See Bus values & styling.
Separator
A blank spacer row for grouping signals — an optional label and a horizontal rule (solid, dashed, or none). Leave the label blank to keep it invisible in exports.
The time ruler
Click the ruler itself, at the top of the canvas, to customize how time is labeled across the whole diagram.

| Property | What it controls |
|---|---|
| Prefix | Text shown before every ruler number, e.g. clk. |
| Suffix | Text shown after every ruler number, e.g. ns — the units your diagram is actually in. |
| Start | What number the ruler begins counting from. |
| Increment | How much the ruler's number advances at each mark. |
This changes only the labels along the ruler — it doesn't rescale your diagram or move any transitions.
How do I set a signal high or low with a double-click?
Double-click anywhere on a signal or bus row to add a transition at that point in time.
Where you click on the row matters: double-clicking the top half of a signal row sets it High; double-clicking the bottom half sets it Low. On a bus row, double-clicking always adds a new segment, which you can then type a value into directly.
To change an existing transition's value rather than add a new one, click the segment right after it and use the Segment Value dropdown in the properties panel.
How do I show a High-Z or glitch state in a timing diagram?
A plain signal supports more than just 0 and 1 — every real-world logic state has its own, distinct look.
| State | Meaning |
|---|---|
| 0 — Low | Logic low. |
| 1 — High | Logic high. |
| Z — High-Z | High impedance / floating — drawn as a dashed line at mid-height. |
| WH — Weak High | Weakly driven high (e.g. a pull-up), drawn distinctly from a fully-driven High. |
| WL — Weak Low | Weakly driven low (e.g. a pull-down). |
| HL — High & Low | Contention — both rails asserted at once, drawn as a filled band spanning the full height. |
| GV — Glitch Dip | A brief, momentary dip while the signal is otherwise High. |
| GC — Glitch Spike | A brief, momentary spike while the signal is otherwise Low. |
Selecting & editing edges
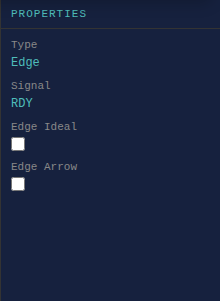
Click directly on a transition (not a segment) to select the edge itself.
| Property | What it does |
|---|---|
| Edge Ideal | Draws this specific edge as a vertical, instantaneous transition, or as a sloped rise/fall, overriding the signal or clock's own default. Once set, a reset button (✕) appears to go back to inheriting from the row. |
| Edge Arrow (signals only) | Shows a small direction arrow on this specific edge, overriding the signal's own Rising/Falling Arrows default. |
Drag a selected edge left or right to move it in time — the segments on either side stretch or shrink to follow.
Segment properties
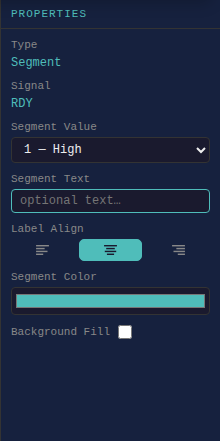
Click inside a segment (between two edges) to select and style it directly — signal and bus segments both work the same way.
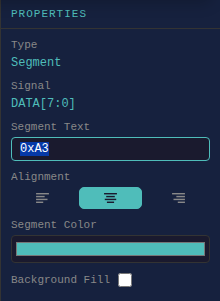
| Property | What it does |
|---|---|
| Segment Value (signal only) | Sets this segment's state — see Signal states for the full list. |
| Segment Text | An optional label drawn inside the segment — the bus's actual value, or any free text on a signal segment. |
| Segment Text Alignment | Left, center, or right, within the segment. |
| Segment Text Font Size | In points. |
| Segment Text Color | Defaults to the segment's own color; a reset button appears once you've changed it. |
| Segment Color | The line/fill color for just this segment, overriding the row's own default. |
| Background Fill | Fills the segment with a solid color, hatch, or crosshatch pattern — see the Fill Style, Fill Color, and Fill Opacity options that appear once it's turned on. |
Signal-wide options
Click a signal's own name (not a segment) to set defaults that apply across its entire row.

| Option | What it does |
|---|---|
| Ideal Edges | Draws every transition on this row as instantaneous and vertical, rather than a sloped rise/fall — the row's own default, which any single edge can still override. |
| Rising Arrows / Falling Arrows | Shows a small direction arrow on every rising or falling edge in this row — the row's own default, which any single edge can still override. |
| Allow Glitch Spikes | Controls which glitch state a double-click creates on this row — see Signal states. |
| Differential | Draws a dashed mirror of this row's own waveform in the same row — useful for showing a signal's complement (e.g. Q̄) without needing a second row. |
| Invert Values (0↔1) | A one-time action, not a toggle — flips every 0 and 1 already drawn on this row. Weak-high/weak-low flip to match; states with no single rail (High-Z, Contention) are left untouched. |
Clock properties
A clock is defined by its parameters, not hand-drawn transitions — click its name to set them.
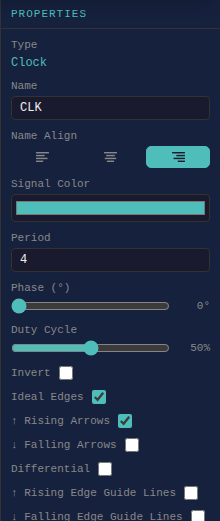
| Property | What it does |
|---|---|
| Period | The full cycle length, in your diagram's own time units. |
| Phase | Shifts the whole waveform left or right, in degrees (0–360°) of one period. |
| Duty Cycle | What percentage of each period is spent High. |
| Invert | Flips which half of each period is High vs. Low. |
| Ideal Edges | Same as on a signal — instantaneous, vertical transitions rather than sloped ones. |
| Rising Arrows / Falling Arrows | Same as on a signal — a direction arrow on every rising or falling edge. |
| Differential | Same as on a signal — a dashed mirror of the clock's own waveform in the same row. |
| Rising Edge Guide Lines / Falling Edge Guide Lines | Extends a faint vertical line down from every rising or falling edge, through every row below it — useful for visually lining up other signals against the clock. |
How do I set a bus value in TimeGen 5?
A bus shows a value as text inside each segment, with a crossing mark at every transition to show where the value actually changes.
Double-click a bus row to add a new segment, then type directly into its Segment Text field to set the value — any text works, not just hex. See Segment properties for the full list of per-segment styling options (fill, colors, alignment), which apply to bus segments exactly the same way they apply to signal segments.
Arrows & Bezier curves
Draw a straight arrow, or a curve, between any two points to call out a relationship in your diagram.
Pick Arrow or Bezier from the toolbar, click a start point, then an end point. Both endpoints snap to real signal edges as you draw — so an arrow pointing at a transition stays attached to it even if you later drag that edge in time.

| Property | What it does |
|---|---|
| Label | Optional text drawn along the line. |
| Start Arrow / End Arrow | Independently show or hide the arrowhead at either end. |
| Snap to transitions | Turn off to let an endpoint sit anywhere, unattached to a specific edge. |
A Bezier curve additionally has a Reset Control Points button — if you've dragged a handle far enough that you can't easily grab it again, this brings both handles back to a modest curve between the two endpoints.
How do I add a setup/hold time label?
A bracket between two points, for calling out a specific measured interval — a setup or hold time, a delay, or anything else you want to put an exact label on.

By default, a new bracket is ready for your own label — type it directly, no extra step needed. Turn on Auto time label to have it calculate and display the actual time between its two ends instead.
| Property | What it does |
|---|---|
| Auto time label | Off by default. When on, replaces your own label with the calculated time between the bracket's two ends. |
| Label | Your own text — shown whenever Auto time label is off. |
| Arrows | Outward, inward, or no arrows on the bracket's own horizontal line. |
| Line | Dashed, solid, or no line for the bracket's horizontal connector. |
| Vertical start line / Vertical end line | Independently show or hide the small vertical end-caps at either side of the bracket. |
| Snap to transitions | Same as on an arrow — turn off to let either end sit unattached to a specific edge. |
Text notes
A free-floating text label, for anything that doesn't need a line or a bracket.

| Property | What it does |
|---|---|
| Text | The note's own content. |
| Font Size | In points. |
| Attached To | Optionally ties the note to a specific row, so it follows that row vertically if you reorder rows later. |
How do I show a gap in the timeline?
Marks a gap in the timeline — useful for skipping a long, uneventful stretch without stretching your whole diagram to fit it.
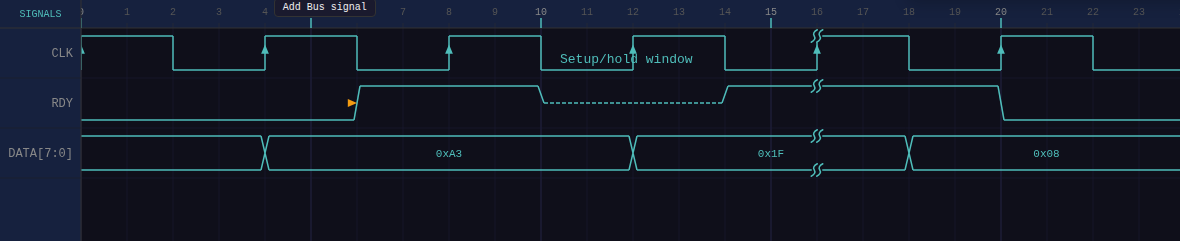
Pick Time Break from the toolbar and click a single row to break just that row, or hold Shift while placing it to break every row in the diagram at once.
Pick Time Break from the toolbar and click a single row to break just that row, or hold Shift while placing it to break every row in the diagram at once.
| Property | What it does |
|---|---|
| Time | The break's exact position — editable directly, or drag it left/right on the canvas. |
| Scope | Read-only display of whether this break spans all rows or just one. |
| Color | Defaults to each row's own color; set one explicitly to override it. |
| Expand to All Rows | Converts a single-row break into an all-rows break, after the fact — you don't need to delete and redo it with Shift held. |
What are TimeGen 5's keyboard shortcuts?
Ctrl+Z and Ctrl+Y — the only two keyboard shortcuts in TimeGen 5.
Every edit — adding a transition, moving an edge, changing a property — is a single undo step. There's no separate shortcut for switching tools; every tool is one click away in the toolbar.
Themes
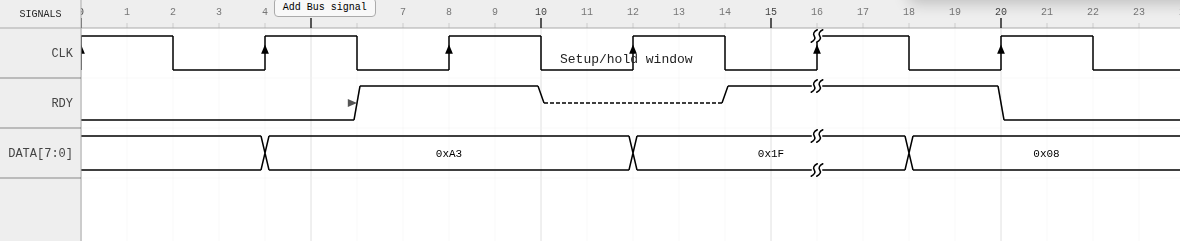
Switch between dark and light from the toolbar — your choice is remembered the next time you open TimeGen.
What's included in TimeGen 5's free plan?
TimeGen 5 has two free ways to try it, and two paid tiers once you need to save, export cleanly, and go beyond the row limits.
| Sandbox No account | Free Registered Sign up, no cost | Professional $9/mo or $79/yr | Enterprise $20/mo or $240/yr | |
|---|---|---|---|---|
| Signal rows | Up to 5 | Up to 7 | Unlimited | Unlimited |
| Arrows / annotations | Up to 2 | Up to 4 | Unlimited | Unlimited |
| PNG export | Sign up to unlock | ✓ | ✓ | ✓ |
| SVG / PDF export | — | — | ✓ | ✓ |
| Save & reload project | — | — | ✓ | ✓ |
| Setup/Hold & Time Breaks | — | — | ✓ | ✓ |
| Watermark | Large, diagonal | Small, corner | None | None |
| Where it runs | In your browser | In your browser | In your browser | On your own computer |
Sandbox needs no account at all — open the app and start drawing immediately. Free Registered gets you a few more rows and PNG export, still at no cost, once you've signed up with an email. Professional adds saving, clean vector export, and removes every row limit. Enterprise is the same Professional feature set, running entirely on your own machine instead of in a browser — for offline use or floating team licenses.